Statistics 1-1
- Introduction to Statistics
- Descriptive Statistics
- Probability Distribution
- Sampling and Sampling Methods
- Estimation and Hypothesis Testing
- Comparison of Two Populations
- Analysis of Variance (ANOVA)
- Regression Analysis
- Nonparametric Statistics
- Statistical Applications in Quality and Productivity
- Software Application in Statistics
Estimation and Hypothesis Testing
Fundamentals of Hypothesis Testing
Alternative ways of computing the statistical significance of a parameter inferred from a data set.
Hypothesis testing is a statistical method that is used in making statistical decisions using experimental data. It is basically an assumption that we make about the population parameter.
Introduction to Hypothesis Testing
Hypothesis testing is a critical tool in inferential statistics, used to determine whether there is enough evidence in a sample of data to infer that a certain condition holds true for the entire population. A hypothesis test examines two opposing hypotheses about a population: the null hypothesis and the alternative hypothesis.
Null and Alternative Hypotheses
The null hypothesis is a statement about the population that either is believed to be true or is used to put forth an argument unless it can be shown to be incorrect beyond a reasonable doubt. On the other hand, the alternative hypothesis is a statement that will be accepted in place of the null hypothesis if the null hypothesis is rejected based on the data.
For example, if we are testing the effect of a drug on patients, the null hypothesis might be that the drug has no effect on the patients, while the alternative hypothesis would be that the drug does have an effect.
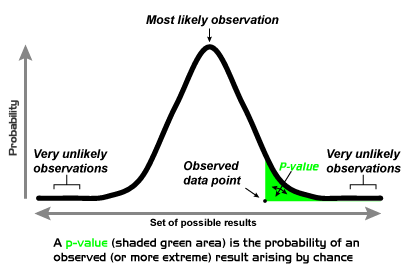
Understanding the P-value
The P-value is a fundamental concept in hypothesis testing. It is the probability that the results of your test occurred at random if the null hypothesis were true. In other words, it's the probability of observing a result as extreme as the test statistic, given that the null hypothesis is true.
If the P-value is less than or equal to the level of significance, we reject the null hypothesis. If the P-value is greater than the level of significance, we do not reject the null hypothesis.
Steps in Hypothesis Testing
- State the hypotheses: The first step is to state the null and alternative hypotheses.
- Formulate an analysis plan: For this step, describe how to use the sample data to accept or reject the null hypothesis.
- Analyze sample data: Using the analysis plan, calculate the value of the test statistic.
- Interpret the results: If the P-value is small, reject the null hypothesis in favor of the alternative hypothesis. If the P-value is large, do not reject the null hypothesis.
One-tailed and Two-tailed Tests
A test of a statistical hypothesis, where the region of rejection is on only one side of the sampling distribution, is called a one-tailed test. For example, suppose a bakery states that each bag of its cookies contains more than 20 chocolate chips on average, then we would use a one-tailed test to see if the claim is true.
On the other hand, a two-tailed test is a statistical test in which the critical area of a distribution is two-sided and tests whether a sample is greater than or less than a certain range of values. If the sample being tested falls into either of the critical areas, the alternative hypothesis is accepted instead of the null hypothesis.
By understanding the fundamentals of hypothesis testing, you can make more informed decisions based on the data at your disposal.